Page 16 - 2board23full
P. 16
03. Market Overview
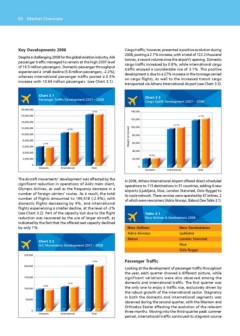
Key Developments 2008 Cargo traffic, however, presented a positive evolution during
2008, posting a 2.7% increase, with a total of 122.2 thousand
Despite a challenging 2008 for the global aviation industry, AIA tonnes, a record volume since the airport’s opening. Domestic
passenger traffic managed to remain at the high 2007 level cargo traffic increased by 0.8%, while international cargo
of 16.5 million passengers. Domestic passenger throughput traffic enjoyed a considerable rise of 3.1%. This positive
experienced a small decline (5.8 million passengers, -2.2%), development is due to a 27% increase in the tonnage carried
whereas international passenger traffic posted a 0.5% on cargo flights, as well to the increased transit cargo
increase with 10.64 million passengers. (see Chart 3.1) transported via Athens International Airport (see Chart 3.3).
Chart 3.1 Chart 3.3
Passenger Traffic Development 2007—2008 Cargo Uplift Development 2007—2008
18,000,000 -0.4% 140,000
16,000,000 07 08 +2.7%
14,000,000 Total 120,000 07 08
12,000,000 +0.5% Weight (in tonnes) 100,000 +3.1% Total
10,000,000 07 08 80,000 07 08
8,000,000 -2.2% International 60,000 International
6,000,000
4,000,000 40,000 +0.8%
20,000
2,000,000
0 07 08 0 07 08
Domestic Domestic
The aircraft movements’ development was affected by the In 2008, Athens International Airport offered direct scheduled
significant reduction in operations of AIA’s main client, operations to 115 destinations in 51 countries, adding 4 new
Olympic Airlines, as well as the frequency decrease in a airports (Ljubljana, Nice, London Stansted, Oslo Rygge) to
number of foreign carriers’ routes. As a result, the total its route network. These services were operated by 67 airlines, 2
number of flights amounted to 199,418 (-2.9%), with of which were newcomers (Adria Airways, Baboo) (See Table 3.1).
domestic flights decreasing by 4%, and international
flights experiencing a smaller decline, at the level of -2% Table 3.1
(see Chart 3.2). Part of the capacity lost due to the flight New Airlines & Destinations 2008
reduction was recovered by the use of larger aircraft, as
indicated by the fact that the offered seat capacity declined New Airlines New Destinations
by only 1%. Adria Airways Ljubljana
Baboo London Stansted
Chart 3.2 Nice
A/C Movements Development 2007—2008 Oslo Rygge
250,000 -2.9% Passenger Traffic
200,000
Looking at the development of passenger traffic throughout
150,000 -1.8% the year, each quarter showed a different picture, while
100,000 significant variations were also observed among the
-4.0% domestic and international traffic. The first quarter was
the only one to enjoy a traffic rise, exclusively driven by
50,000 07 08 07 08 the robust growth of the international sector. Stagnancy
in both the domestic and international segments was
0 07 08 International Total observed during the second quarter, with the Western and
Orthodox Easter affecting the evolution of the relevant
Domestic three months. Moving into the third-quarter peak summer
period, international traffic continued its stagnant course