Page 88 - 2board23full
P. 88
Financial Statements
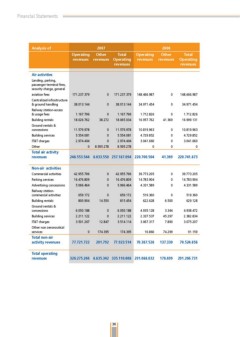
Analysis of 2007 2006
Οperating Other Total Οperating Other Total
revenues revenues Operating
revenues revenues Operating revenues
revenues
Air activities
Landing, parking,
passenger terminal fees,
security charge, general
aviation fees 171.7.79 0 171.7.79 148.466.987 0 148.466.987
Centralized infrastructure
& ground handling 8.01.144 0 8.01.144 4.971.454 0 4.971.454
Railway station-access 1.167.796 0 1.167.796 1.71.86 0 1.71.86
& usage fees 41.69 16.999.11
Building rentals 18.06.76 8.7 18.065.04 16.957.76
Ground rentals & 11.579.978 0 11.579.978 10.819.96 0 10.819.96
concessions 0 4.79.85
0 .041.660
Building services 5.554.081 0 5.554.081 4.79.85 00
IT&T charges .974.404 0 .974.404 .041.660
Other 0 8.595.78 8.595.78 0
Total air activity 248.553.544 8.633.550 257.187.094 220.700.504 41.369 220.741.873
revenues
Non-air activities 0 9.77.05
0 14.78.904
Commercial activities 4.955.796 0 4.955.796 9.77.05 0 4.1.589
16.476.809 0 16.476.809 14.78.904
Parking services 5.066.464 0 5.066.464 4.1.589 519.60
69.18
Advertising concessions 659.17 0 659.17 519.60 0
800.904 14.550 815.454 6.68 6.500 4.98.47
Railway station- .8.84
commercial activities 6.050.188 0 6.050.188 4.95.18 .44 .075.07
.11.1 0 .11.1 .7.57 45.97
Building rentals .501.67 1.847 .514.114 .067.17 7.890 91.159
Ground rentals & 0 174.95 174.95 16.860 74.99 70.524.858
concessions
77.721.722 201.792 77.923.514 70.387.528 137.330
Building services
IT&T charges
Other non aeronautical
services
Total non-air
activity revenues
Total operating 326.275.266 8.835.342 335.110.608 291.088.032 178.699 291.266.731
revenues
6